Fibonacci trading
What are Fibonacci numbers ?
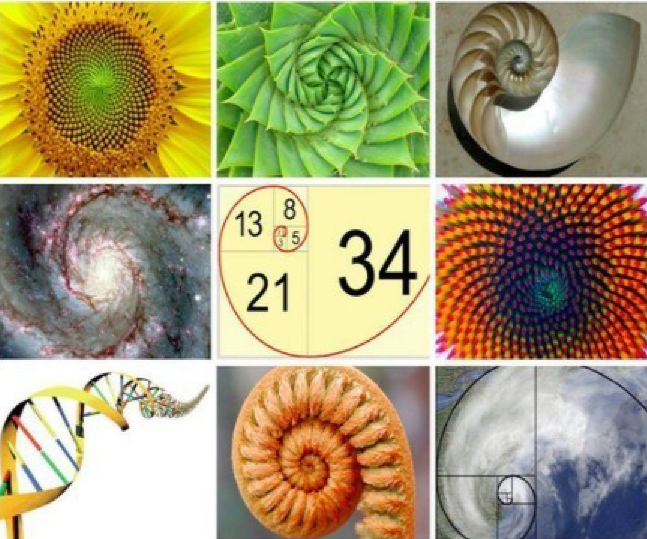
🔹 Fibonacci numbers are a numerical series depicting nature’s expansion
🔹 The same number sequence appears all over throughout nature. i.e.
🔸 The number of petals on a flower
🔸 A snail shell
🔹 The sequence is made by simply starting at 1 and adding the previous number to arrive at the new number:
0+1=1, 1+1=2, 2+1=3, 3+2=5, 5+3=8, 8+5=13, 13+8=21, 21+13=34,…
🔹 Other important properties are the ratios when comparing any number to the number that is found 'X' places to the right:
🔸 0.618- A.k.a the "Golden Ratio" - where X = 1
🔸 0.382 - where X = 2
🔸 0.236 - where X = 3
🔹 It is these Ratios that have a correlation to market movements in terms of price and time cycle
🔹 We use them to provide targets for:
🔸 Price Extensions
🔸 Price Retracements
🔸 Time Cycles

How Fibs are used in Trading?
🔹 Firstly we need to talk very basic Wave Theory / Elliot Wave
🔹 While stock market prices may appear random and unpredictable, they actually follow predictable, natural laws and can be measured and forecast using Fibonacci numbers
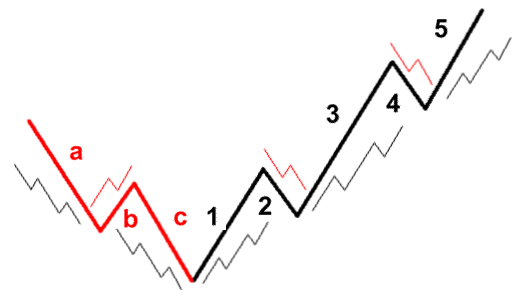
🔹 Without going to deep, the basic principle is; waves move in Impulses & Corrections
🔸 Impulse waves (BLACK) are made up of 5 sub waves
🔸 Corrections (RED) are made up of 3 sub waves
🔹 Impulses & Corrections go in both directions
🔹 Waves are fractal in nature i.e. drill deeper & find the same patterns in a lower degree / time frame
🔹 Trend direction will determine if the impulse's are up or down
🔹 Elliot Wave has a lot more to it which i will cover another time
🔹 Fib Extensions, Retracements & Time Cycles help predict key price levels
🔹 Extensions, provide price targets
🔹 Retracements, provide areas of support and reversal
🔹 Time Cycles, give some indication of WHEN the wave will complete

Using Fib Extensions
🔹 Common Fibonacci extension levels are 61.8%, 100%, 161.8%, 200%, and 261.8%
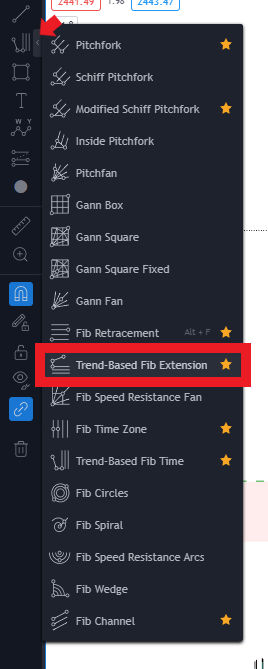
🔹 TradingView has a Trend-base Fib Extension tool that helps plot levels on a chart
🔹 See below for where to find the extension tool
🔹 I use Fib extensions to help predict where the next wave will finish
🔹 For impulse's and correction see the below for details and rules

Using Fib Retracements
🔹 Common Fibonacci retracements levels are 23.6%, 38.2%, 50%, 61.8%, 78.6% and 88.7%
🔹 TradingView has a Fib Retracement tool that helps plot levels on a chart
🔹 See below for where to find the Retracement tool
🔹 I use Fib retracements to help predict where the next wave opposite to the trend will finish
🔹 For impulse's and correction see the below for details and rules


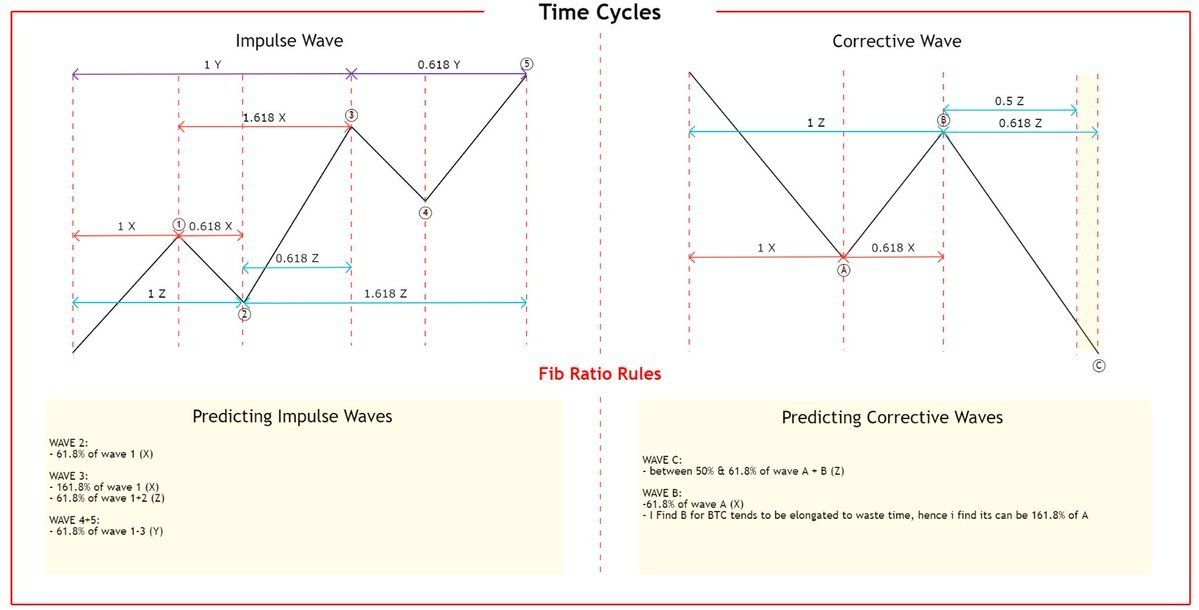
Using Time Cycles
🔹 A little less know or used form of the Fib Ratios, is to use it to help determine time cycles
🔹 TradingView has a couple of Fib Time tool that helps plot levels on a chart
🔹 See below for where to find these tools
🔹 I use Fib Time tools to help me determine when i need to start paying more attention to a particular market
🔹 For impulse's and correction see the below for details and rules