Relative Strength Index
The relative strength index (RSI) is a momentum indicator used in technical analysis that measures the magnitude of recent price changes to evaluate overbought or oversold conditions in the price of a stock or other asset.
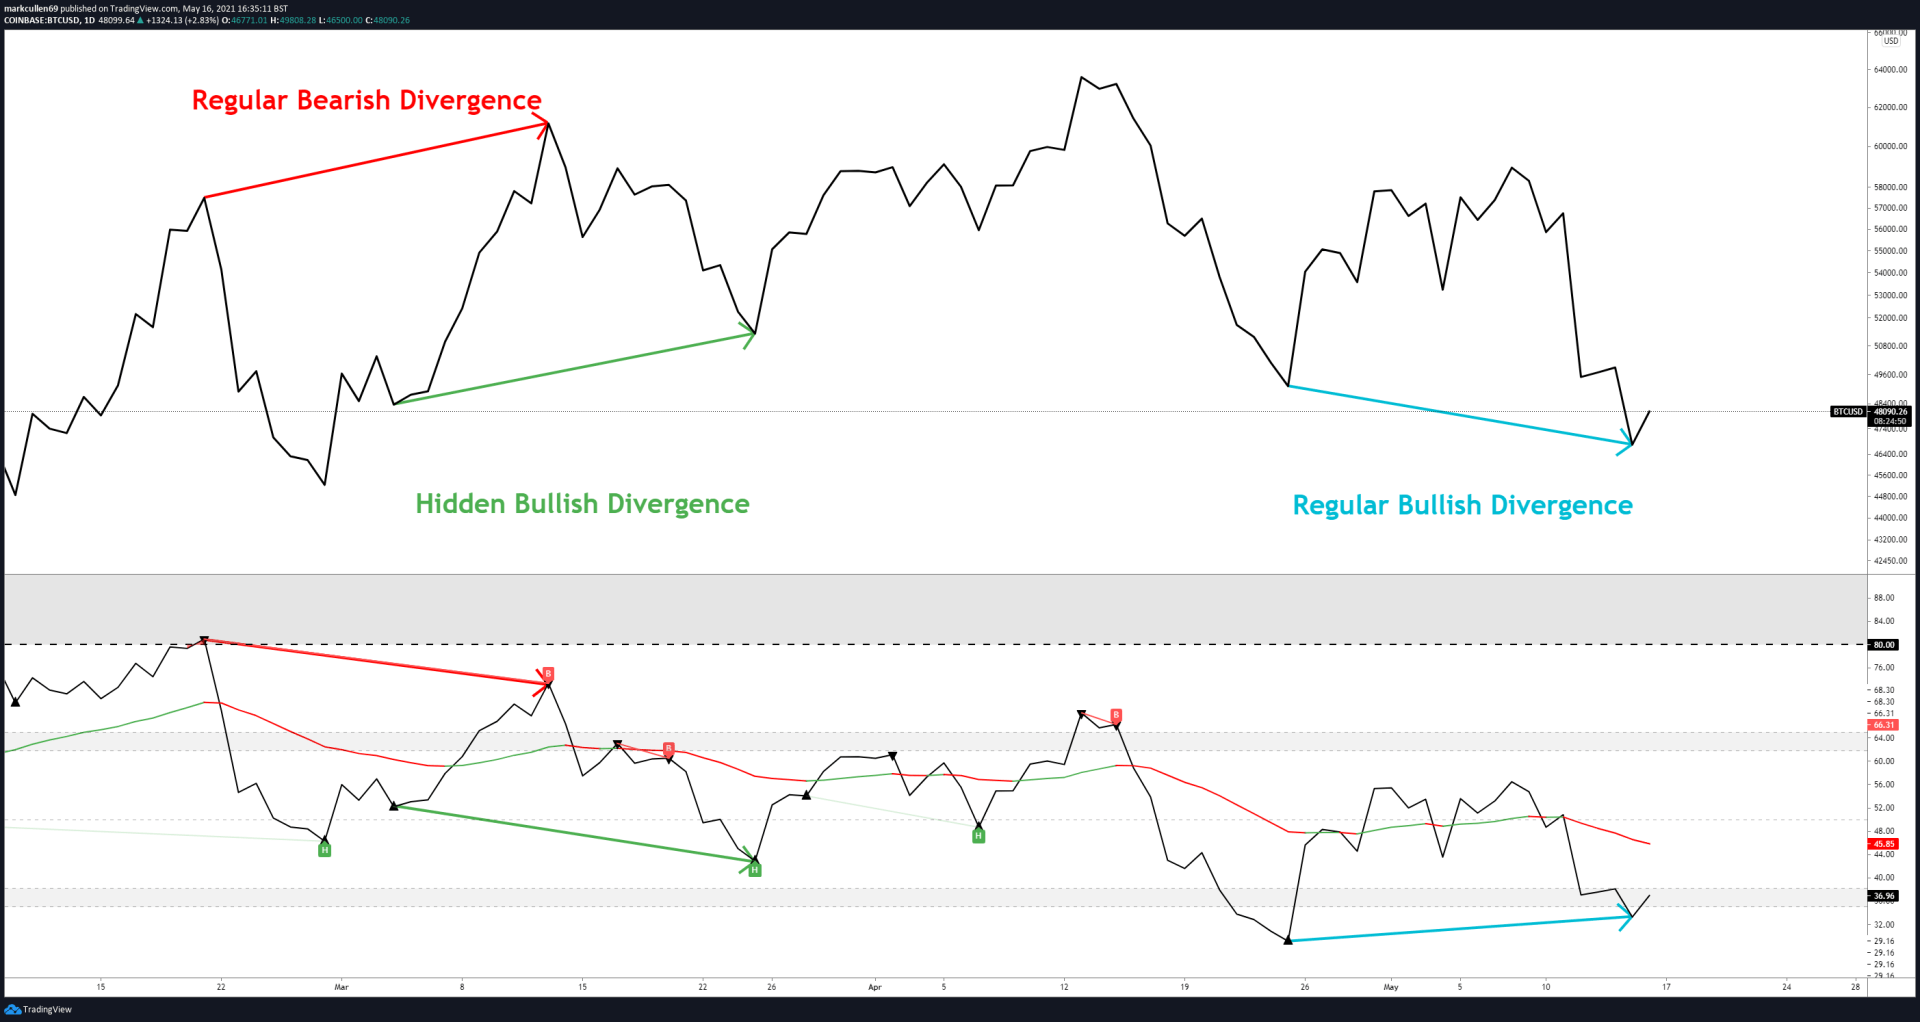
Example of RSI Divergences:
When the RSI creates an oversold reading followed by a higher low that matches with lower lows in the price it means that the RSI is being oversold and this is a Bullish divergence.
But when RSI is overbought reading followed by a lower high that matches with higher highs on the price, that it is a bearish divergence.
As you can see in the following chart, a bullish divergence was identified when the RSI formed higher lows as the price formed lower lows. This was a signal, but divergences can be rare when a stock is in a stable long-term trend. Using flexible oversold or overbought readings will help find more potential signals.
Example of RSI swing Rejections:
Another trading technique examines the RSI's behavior when it is reemerging from overbought or oversold previous times. This signal is called a bullish "swing rejection" and has four points:
1. RSI falls into oversold territory.
2. RSI crosses back above 30%.
3. RSI forms another dip without crossing back into oversold territory.
4. RSI then breaks its most recent high.
TBD
TBD
TBD
TBD